Megacity Logistics Lab
Case Study
Projects

Team

Megacity Logistics Lab
Innovative theoretical and applied research to help companies operate better
logistics for cities and governments to design better cities for logistics.
An Initiative of the MIT Center for Transportation & Logistics
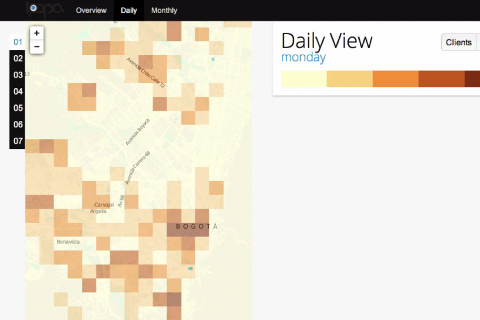
Last Mile is a project focused on visualizing information relevant to logistic operations in different contexts, collecting and displaying urban and corporate information. Last Mile is composed of three different platforms: Km2, Loopa, Compass and CartoKm2.
Companies collect tens of thousands of data elements every day from a variety of systems and sensors in their logistics operations. Often, this data is archived and not used to improve or re-design their last-mile activities. Leveraging recent advances in data analytics, we are prototyping new algorithms that process GPS and cellphone traces to extract information on congestion, stop time times and dynamic route choices.
In addition to helping companies use data they currently collect to analyze urban delivery routes in more detail, the MIT Megacity Logistics Lab is also developing more advanced modeling techniques. An example is a simulation of a megacity location that allows managers to move physical representations of resources, such as distribution centers, and see how such moves change the cost profile of a distribution network. The simulation functions as both a planning aid and a learning tool.
As megacities continue to expand, and the growth in ecommerce adds another layer of complexity to urban distribution networks, models that help companies to streamline the last mile will become even more important.
Logistics is an enabler of quality of life in cities: it delivers goods and services to city dwellers enabling them to enjoy all the benefits of the urban environment. There are, however, three major drivers of increased complexity of urban logistics networks that calls for a new thinking on city logistics.
First, urbanization is progressing at a high pace. While in 1950 only 54.5% of the population in developed countries was in urban areas, this number had risen to 77.7% by 2011 and is projected to reach 85.9% by 2050. Moreover, 25% of the world population and almost 60% of the world’s gross domestic product (GDP) will be found in the world’s 600 largest cities by 2025. Megacities, urban areas with over 10 million people, are an example of this new era of urbanization. Megacities allow us to focus in the most complex environments, but we aim for our work to be applied to urban areas of all sizes.
Second, the growth of Internet and mobile phone based electronic commerce is triggering an increasing amount of direct shipments from manufacturers and retailers to individuals. Direct deliveries do not only increase complexity of last-mile urban transportation networks, they also lead to fragmentation of shipments and higher complexity and greater need for coordination between consumers, retailers and manufacturers to distribute goods efficiently. These changes in consumer buying behaviors are a challenge and an opportunity to design future urban logistics networks.
Finally, on-going efforts from cities to invest in public transportation, limiting road access and parking spaces in favor of pedestrian and public transit infrastructure, disproportionally impact logistics operations. Since urban freight also generates an important share of congestion, pollution and other negative externalities, city logistics activities are always under pressure from regulatory actions. Private and public sector need to collaborate to find the right balance to improve the quality of life in the urban environment. Our work will bring together business, logistics and urban planning perspectives so we can develop technologies and policies that gets the most out of the limited urban space and infrastructure.
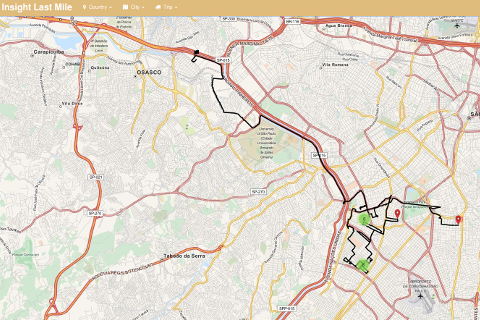
Insight Last Mile provides insights from a micro-level, company-centric perspective, and online simulation and optimization capabilities. It also provides researchers with interactive means to generate new insights in the domains of distribution network design, logistics data analysis, and urban freight policy design of their last-mile delivery operations.
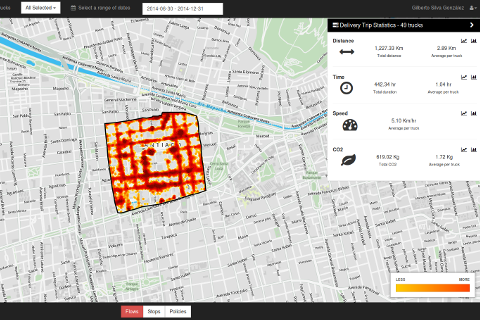
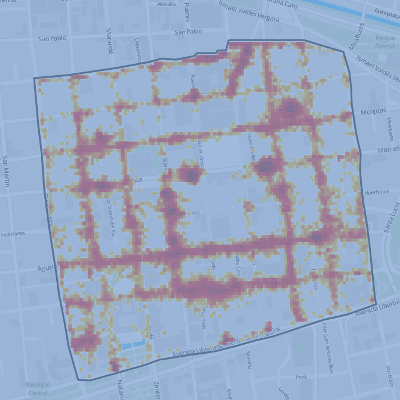
CartoKM2 is a web platform designed to help cities develop and evaluate better urban freight policies. By combining high-resolution vehicle data from GPS traces, commercial transactions, and overall economic activity, CartoKM2 facilitates urban logistics stakeholders to explore the impact of freight in urban areas.
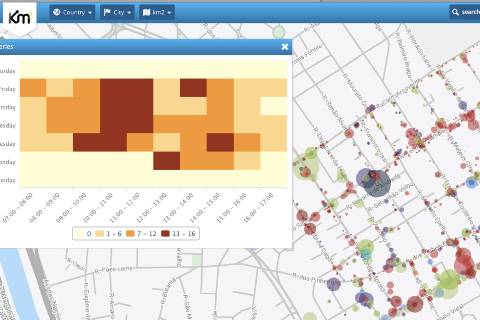
KM2 is an open-access pool of data relevant for logistics policy analysis, at selected square-kilometers from around the world. This data was collected by students and researchers affiliated with the MIT Megacity Logistics Lab, supported by grants from the MIT Center for Transportation & Logistics, the MIT MISTI program and the MIT IROP program, alongside researchers at our affiliated Global Labs.
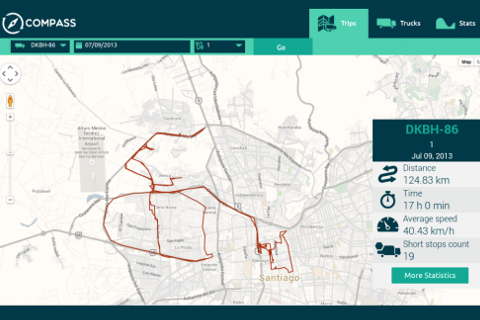
Compass is an open source platform to visualize and analyze GPS traces.
Through a simple to use interface and intuitive geographical navigation, we explore ways for companies to visualize large amounts of urban delivery transactional data.

Megacity Logistics Lab Director

Megacity Logistics Founder

Megacity Logistics Lab Researcher

Megacity Logistics Lab Researcher

Professor at Monterrey Tech

Professor at Monterrey Tech

Professor at Monterrey Tech

Student of Monterrey Tech

Student of Monterrey Tech

Student of Monterrey Tech

Student of Monterrey Tech

Student of Monterrey Tech

Student of Monterrey Tech

Student of Monterrey Tech

Student of Monterrey Tech

Student of Monterrey Tech